术语
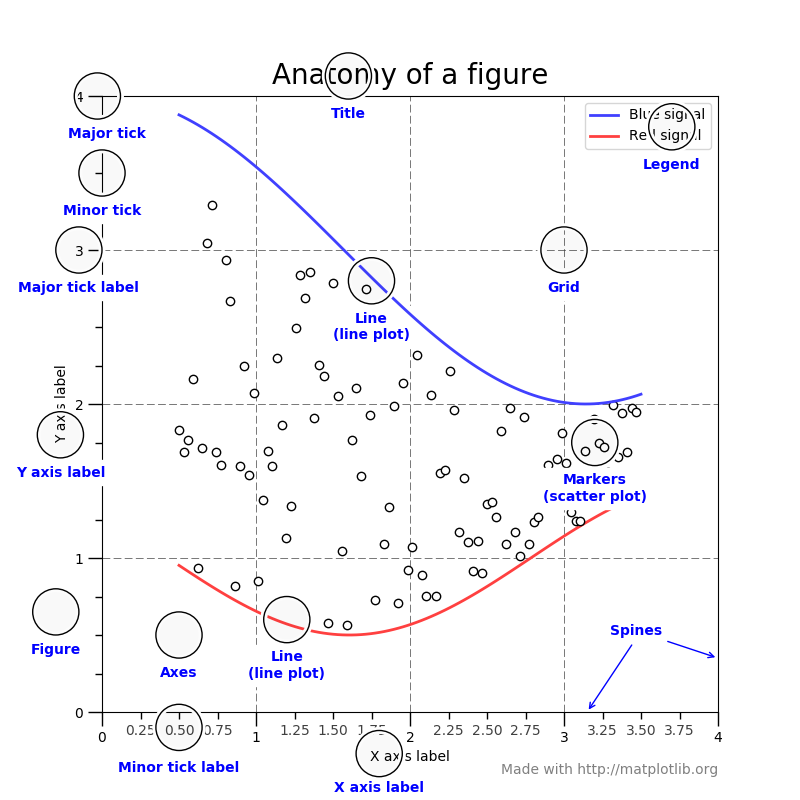
颜色列表:
缩写 | 颜色 :--------:|:--------:| b | Blue g | Green r | Red c | Cyan m | Magenta y | Yellow k | Black w | White
RGB或RGBA,A表示透明度。16进制的表示:'#ff0000'。灰度图的深度比如0.1,0.32, 0.5或0.75.
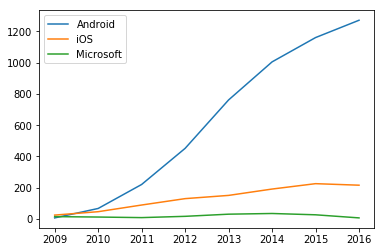
设置不同的颜色:colors.py
import matplotlib.pyplot as plt

years = list(range(2009,2017))
android = [6.8,67.22,220.67,451.62,761.29,1004.68,1160.21,1271.02]
ios = [24.89,46.6,89.27,130.13,150.79,191.43,225.85,216.07]
microsoft = [15.03,12.38,8.76,16.94,30.71,35.13,26.74,6.94]

plt.plot(years,android,label='Android')
# color='C0' by default
plt.plot(years,ios,label='iOS')
# color='C1' by default
plt.plot(years,microsoft,label='Microsoft') # color='C2' by default
plt.legend()
plt.show()
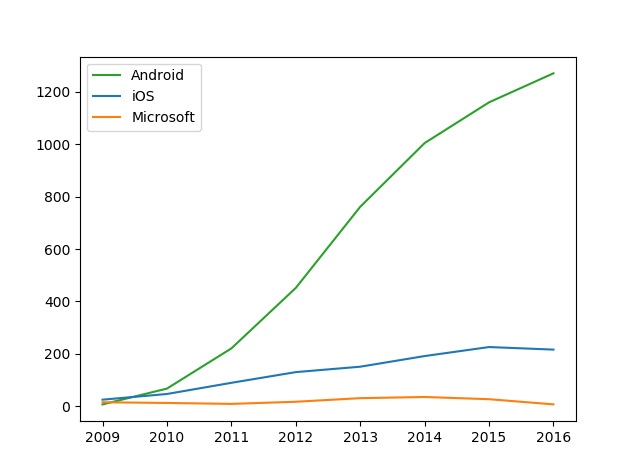
交换颜色顺序:colors2.py
import matplotlib.pyplot as plt

years = list(range(2009,2017))
android = [6.8,67.22,220.67,451.62,761.29,1004.68,1160.21,1271.02]
ios = [24.89,46.6,89.27,130.13,150.79,191.43,225.85,216.07]
microsoft = [15.03,12.38,8.76,16.94,30.71,35.13,26.74,6.94]

plt.plot(years,android,label='Android',c='C2')
plt.plot(years,ios,label='iOS',c='C0')
plt.plot(years,microsoft,label='Microsoft',c='C1')
plt.legend()
plt.show()
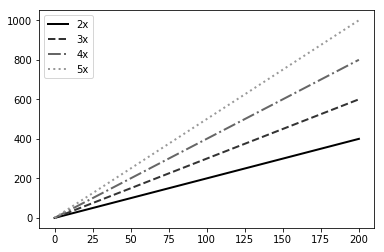
设置线型:lines.py
import matplotlib.pyplot as plt

years = list(range(2009,2017))
android = [6.8,67.22,220.67,451.62,761.29,1004.68,1160.21,1271.02]
ios = [24.89,46.6,89.27,130.13,150.79,191.43,225.85,216.07]
microsoft = [15.03,12.38,8.76,16.94,30.71,35.13,26.74,6.94]

plt.plot(years,android,label='Android',c='C2')
plt.plot(years,ios,label='iOS',c='C0')
plt.plot(years,microsoft,label='Microsoft',c='C1')
plt.legend()
plt.show()
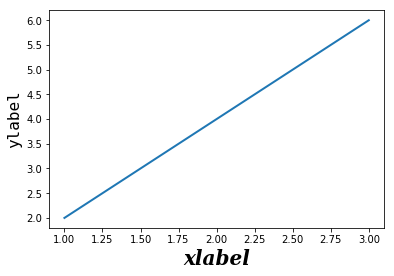
设置字体:font.py
import matplotlib.pyplot as plt

fontparams = {'size':16,'fontweight':'light','family':'monospace','style':'normal'}
x = [1,2,3]
y = [2,4,6]
plt.plot(x,y)
plt.xlabel('xlabel',size=20,fontweight='semibold',family='serif',style='italic')
plt.ylabel('ylabel',fontparams)
plt.show()
设置字体:all_fonts.py
from matplotlib.font_manager import findSystemFonts
print(findSystemFonts(fontpaths=None, fontext='ttf'))

执行结果:

:::python
 python3 all_fonts.py
['/usr/share/fonts/truetype/dejavu/DejaVuSans-Bold.ttf', ... ]
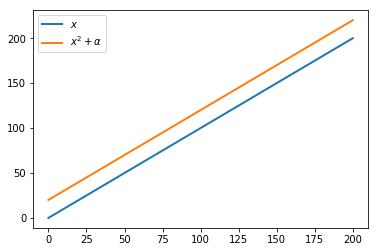
latex.py
import numpy as np
import matplotlib.pyplot as plt

x = np.linspace(0,200,100) # Prepare 100 evenly spaced numbers from 0 to
200
y1 = x # Prepare an array of y equals to x squared
y2 = x+20
# Plot a curve of square numbers
plt.plot(x,y1,label = '$x$')
plt.plot(x,y2,label = r'$x^2+\alpha$')
plt.legend()
plt.show()
更多样式: